Remember the previous example? When we where at Brussels for the JMP Discovery Summit it was for sure nice to see all the sights in brussels on a map in JMP. But wouldn't it be even better to see the most efficient order in which we should visit them? Thats what TSPs - or Traveling Salesperson Problems - are all about. If you want to visit k cities: What is the fastest way to do that? While the problem might sound simple it is fairly computerintensive to solve.
Similarly like for the geocoding I was able to find some R-functions that do the hard work for us (r-package: TSP from Hahsler and Hornik). Thus for us it's just a matter of a few clicks and time!
For the example I will use a smaller dataset though. First of all it is not realistic to visit all 42 places in a day and: Using the whole data you will need to get 42*42 distances. These are 1764 queries for the google maps API. If you are not a commercial user this will need most of the 2500 free queries that you get every day!
Let's focus on our 5 most favorite comics:
Remember: Column Address contains all the addresses from the Brussels Comic Tour and that is all we need. Just select Add-Ins -> Spatial Data Analysis -> TSP in JMP's main menu.
There are 3 sections in the advanced settings:
- Metrics: Are you going to walk by foot, use a bike or the car? Do you want to optimize (minimize) the distance (meters, miles) or the time (minutes) it takes to visit all places?
- Algorithms: This is more technical and I would like to refer to the documentation of the TSP-package if you are interested in the details of the different algorithms. In my experience it is often useful to give multiple algorithms a try, as they might give you different results for your problem.
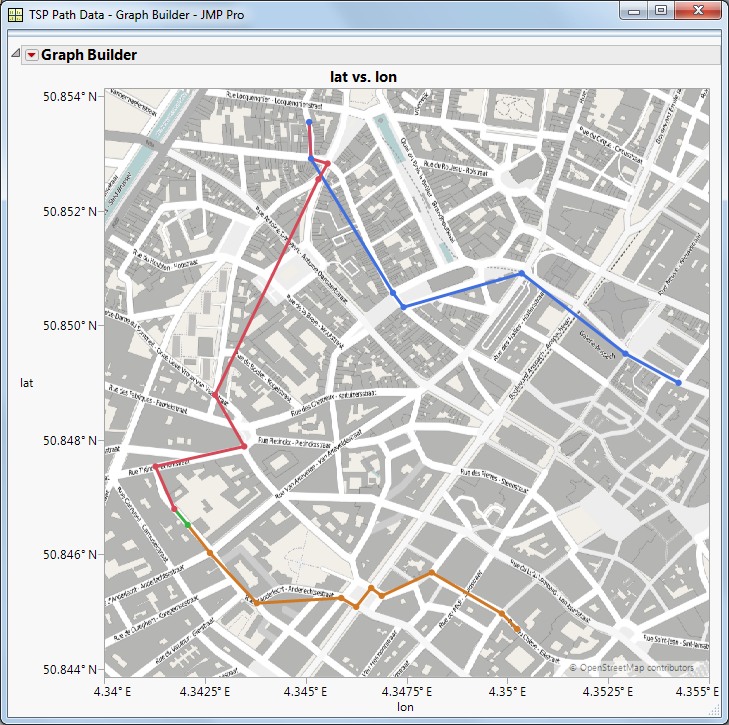
- The last section asks if JMP should visualize the final route. Just give it a try and select the checkbox.
The number of iterations is controlling how often the used algorithms is used. This is needed as the algorithms do not always find the best solution on the first try. For our 5 places it shouldn't be that hard to calculate it a couple of times. Let's use the default 25.
After a couple of seconds you will get this result:
If you pressed the Display Route-checkbox, you will get this more detailed graph of the route automatically:
Literature
- Michael Hahsler and Kurt Hornik (2015). TSP: Traveling Salesperson Problem (TSP). R package version 1.0-10. http://CRAN.R-project.org/package=TSP
- Michael Hahsler, and Kurt Hornik (2007), TSP - Infrastructure for the traveling salesperson problem. Journal of Statistical Software 23/2. URL: http://www.jstatsoft.org/v23/i02/.


Keine Kommentare:
Kommentar veröffentlichen